

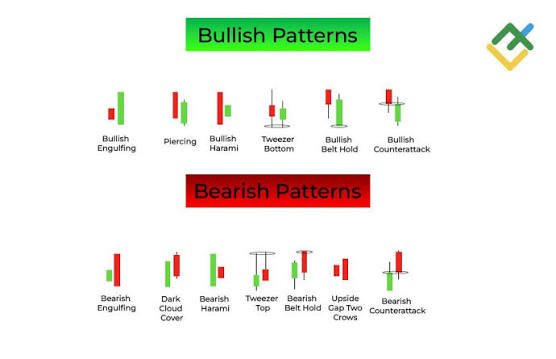
Candlestick patterns are one of the most powerful visual tools available to traders. Each candle tells a story about the battle between buyers and sellers, and learning to read them can dramatically improve your timing.
The Anatomy of a Candle
Every candle has a body and two wicks. The body shows the open and close price, while the wicks show the high and low. Green or white candles mean buyers controlled the session, while red or black candles mean sellers had the upper hand.
Key Patterns to Know
- Hammer: A small body with a long lower wick, usually signalling a potential reversal after a downtrend.
- Bullish/Bearish Engulfing: A large candle that completely covers the previous candle, indicating a strong shift in momentum.
- Doji: A candle where open and close are nearly equal, showing indecision and possible trend change.
- Shooting Star: A small body with a long upper wick, often warning of a bearish reversal at the top of an uptrend.
Combine with Other Tools
Candlestick signals are strongest when combined with support and resistance levels, volume and moving averages. Never rely on a single candle alone for your decision.
Want to master price action? Join the practical candlestick modules at Trade Link Prime and learn with real market charts under expert guidance.